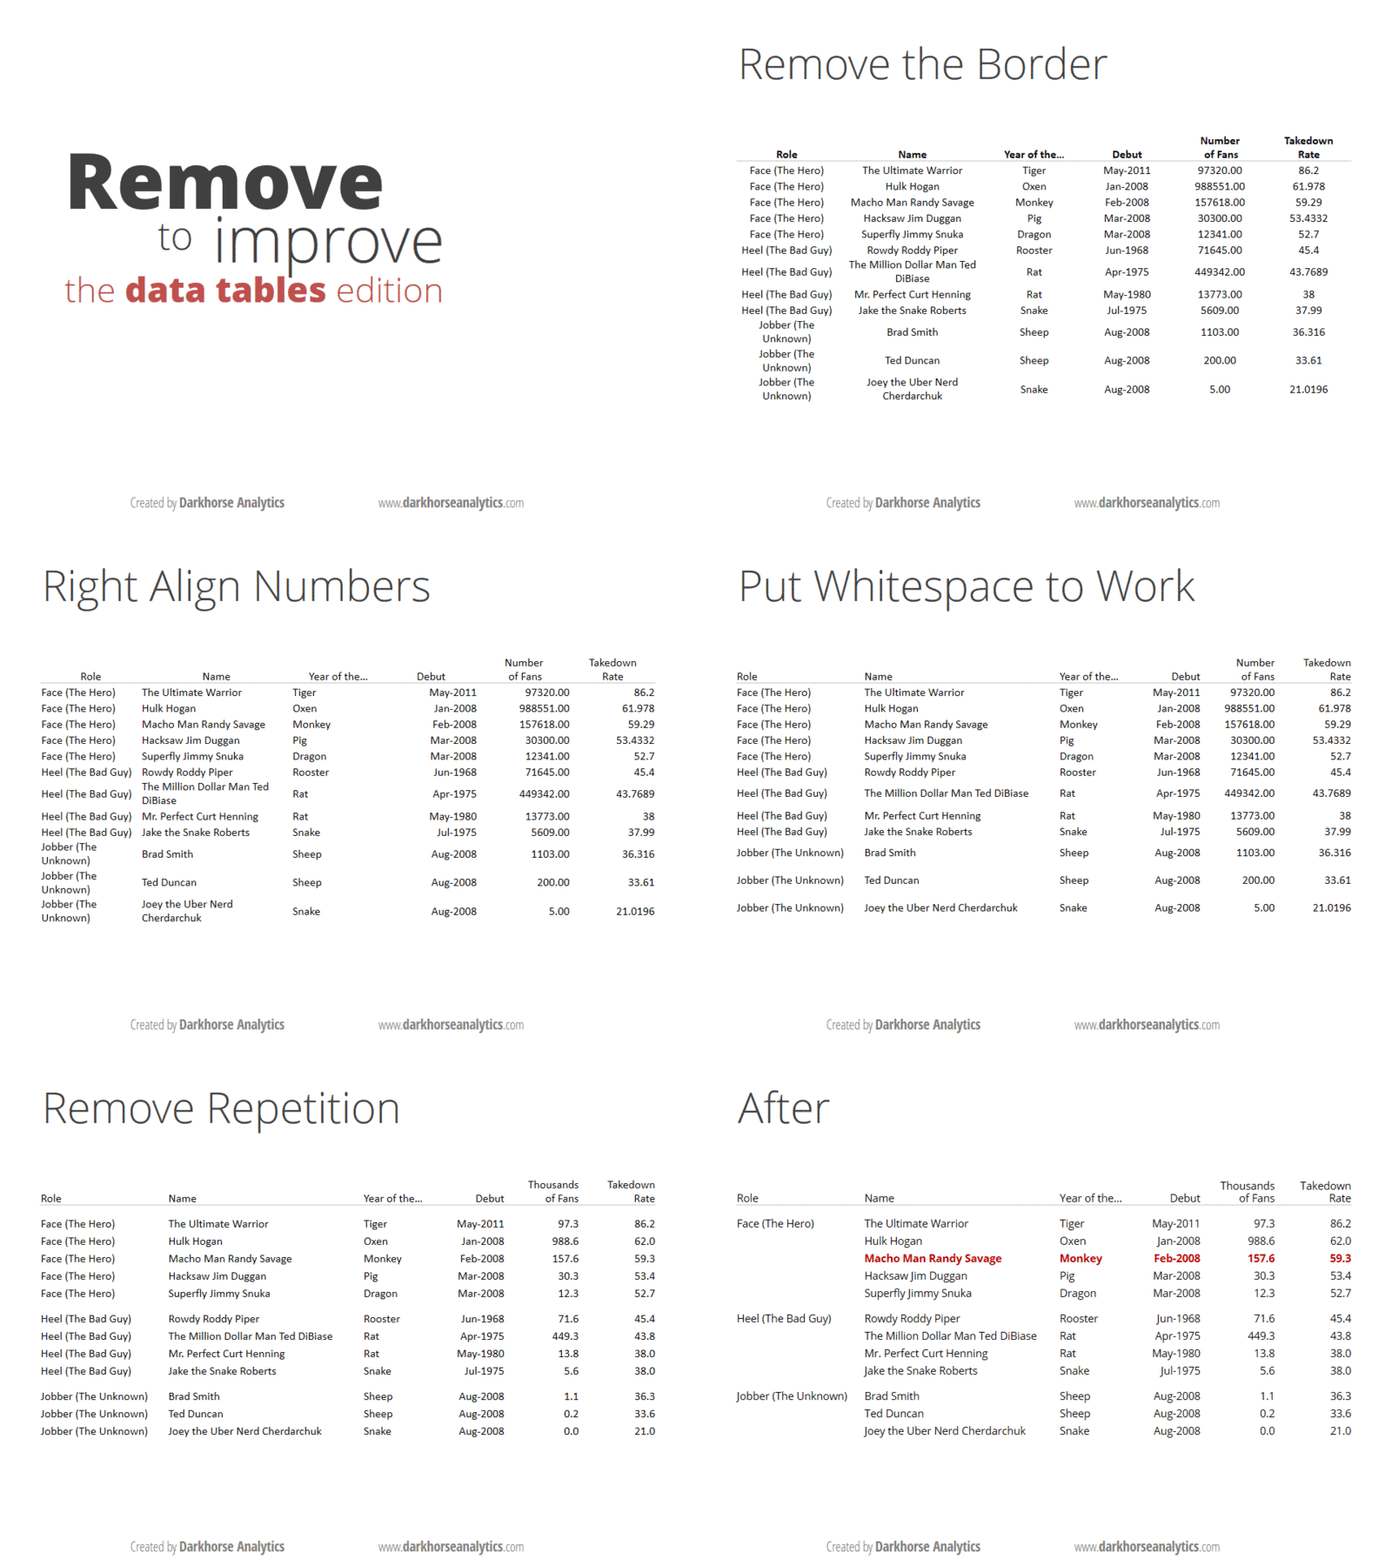
Following their great Data Looks Better Naked post, the clever guys at Dark Horse Analytics have created a guide on how to remove Chartjunk and create really clean and expressive tables.
The gif above pretty much sums it up, but go and read the full post.
