amCharts is a new JavaScript library for creating charts on the web. It handles many types of charts and it’s somewhat reminiscent of D3.js.
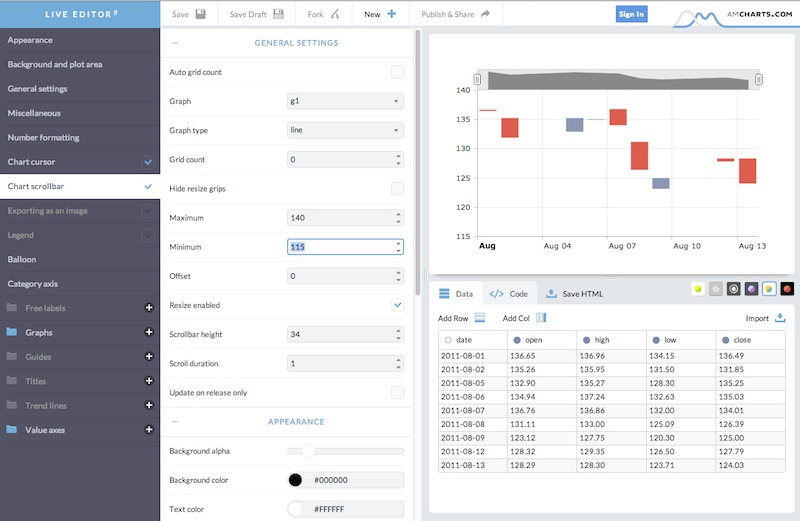
Its most exciting feature is a live editor, which removes the grunt work related to your typical JavaScript charting library and enables you to design, change and export your chart to HTML and include it in your website or dashboard. You can try it out for free here. Amazing work and amazing tool.
For me, the most important feature is the ability to show a chart scrollbar that enables you to zoom in and out of a section of the chart, in less than 5 minutes, like so: